The Roadmap Collector, and Why Snapshots
The previous article covered the GraphQL query that reads our project board, why it reads the board rather than the issues, and the token scopes it needs. This article is the collector around that query.
It follows the same skeleton as the cost and HubSpot collectors and I will not repeat the identical parts. What is worth its own article is the reason this one writes a full snapshot every day rather than tracking changes, and what that buys.
Why snapshots
A project board is pure state. An item moves from Todo to In progress and nothing is emitted. There is no event stream to subscribe to, no webhook that carries the previous value, and no history endpoint. GitHub knows what your board looks like right now and has no interest in telling you what it looked like in August.
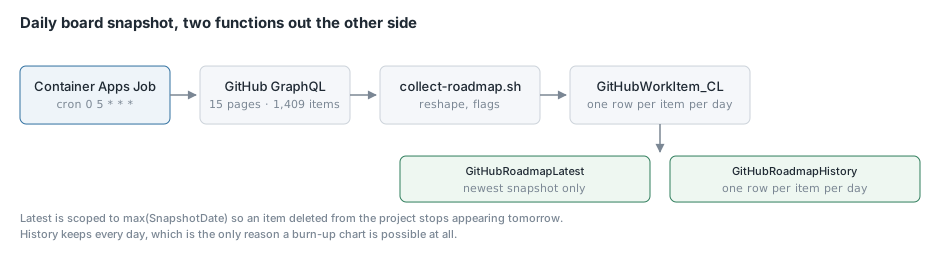
So the collector writes every item, every day, tagged with the snapshot date:
about 1,400 items × 1 snapshot per day
The same item is written every day forever, on purpose. GitHubRoadmapLatest scopes to the newest snapshot and the dashboards read that. The older snapshots cost almost nothing and buy something the source system cannot give you at any price: history.
That is what makes a burn-up chart possible. After a month of collection you can plot how much was in MVP scope and how much was complete on each day, and see whether the gap is closing or whether scope is being added as fast as it is burned down. GitHub cannot draw that chart about its own data.

Two saved functions come out of the same table:
// current board
GitHubWorkItem_CL
| where SnapshotDate == toscalar(GitHubWorkItem_CL | summarize max(SnapshotDate))
| summarize arg_max(TimeGenerated, *) by ItemId

// one row per item per day
GitHubWorkItem_CL
| summarize arg_max(TimeGenerated, *) by SnapshotDate, ItemId
The first is scoped to the latest snapshot rather than taking arg_max over all history, so an item removed from the project stops appearing tomorrow instead of haunting the board.
The cost of the alternative
I did briefly consider running this every fifteen minutes, because work-in-progress numbers would be fresher.
about 1,400 items, ninety-six runs a day, is about 135,000 rows a day to say the same thing the daily snapshot says. The dedup key is (SnapshotDate, ItemId), so all ninety-six of those collapse back to ~1,400 at query time anyway. You would pay ingestion for a hundred times the data and get an identical chart.
That is what pushed the fast-moving data into a separate job, which is the next article.
Step 1: Paginate to files
The board is fifteen pages at a hundred items each. Same rule as the HubSpot collector: pages go to files, not into a shell variable.
WORK=$(mktemp -d)
trap 'rm -rf "$WORK"' EXIT

while :; do
  PAGE=$((PAGE + 1))
  BODY=$(jq -n --arg q "$QUERY" --arg org "$GITHUB_ORG" \
    --argjson num "$GITHUB_PROJECT_NUMBER" --arg after "$AFTER" \
    '{query: $q, variables: {org: $org, number: $num,
      after: (if $after == "" then null else $after end)}}')

  RESP=$(curl -s -X POST "https://api.github.com/graphql" \
    -H "Authorization: Bearer ${GITHUB_TOKEN}" \
    -H "Content-Type: application/json" --data "$BODY")

  # GraphQL answers 200 with an errors array, so a clean curl exit proves nothing.
  if echo "$RESP" | jq -e '.errors' >/dev/null 2>&1; then
    echo "ERROR: $(echo "$RESP" | jq -c '.errors')" >&2
    exit 1
  fi

  echo "$RESP" | jq '.data.organization.projectV2.items.nodes' \
    > "${WORK}/page_$(printf '%04d' "$PAGE").json"

  [[ "$(echo "$RESP" | jq -r '.data.organization.projectV2.items.pageInfo.hasNextPage')" == "true" ]] || break
  AFTER=$(echo "$RESP" | jq -r '.data.organization.projectV2.items.pageInfo.endCursor')
  sleep 0.2
done

jq -s 'add' "${WORK}"/page_*.json > "${WORK}/items.json"
This is the collector where I first hit the argv limit properly. Accumulating fifteen pages of items with jq --argjson put the growing blob on the argv, and about 1,400 items blew past Linux’s 128 KB per-entry cap. The error is “Argument list too long”, which reads like a jq bug and is a size limit.
I had fixed the same class of thing in the HubSpot collector days earlier and did not think to look at the curl ten lines below the jq I had just fixed. Both directions go through files now.
Step 2: Reshape, with the flags computed here or later
The jq that turns a project item into a row is the longest single expression in any of our collectors, and most of it is the union handling from the previous article.
A few decisions are made at collection time rather than at query time, and the rule I ended up with is: compute it in the collector when it depends on configuration the query layer should not know about, and compute it in the saved function when it is a definition the dashboard depends on.
Scope and Phase are computed in the collector, because they depend on which label means “in scope” and which labels mean which phase, and those are variables:
SCOPE_LABEL="IN SCOPE - MVP"
PHASE_LABELS="PHASE-1,PHASE-2,PHASE-3"
Scope: (if ($labels | index($scopeLabel)) then "MVP" else "" end),
Phase: ([ $phaseList[] | select(. as $p | $labels | index($p)) ] | first // "")
Scope becomes the string "MVP" rather than the label text, because the label is configuration and reads badly in a query, while the meaning is not.
Status order is the same kind of thing:
StatusOrder: (($orderList | index($status)) // 99)
The board’s columns in workflow order come from a Terraform variable, so a panel can sort a funnel without hardcoding the column names, and adding a column in GitHub is a change in one place. Anything not in the list gets 99 and sorts last, which is what you want for a blank status.
By contrast, IsWip and IsStuck live in the saved function, because those are definitions the dashboard argues about and I wanted to be able to retune them without re-collecting.
Step 3: Handle content that will not resolve
An item whose content cannot be read comes back with a null content node rather than an error. The reshape gives it sensible defaults:
ContentType: ($c.__typename // "Unknown"),
Number:      ($c.number // 0),
Title:       ($c.title // "(untitled)"),
Number defaults to zero rather than null so the column stays numeric and a panel can sort on it without special-casing drafts, which genuinely have no number.
The important part is that this is reported rather than swallowed:
UNRESOLVED=$(jq '[.[] | select(.ContentType == "Unknown")] | length' "${WORK}/rows.json")
if [[ "$UNRESOLVED" != "0" ]]; then
  echo "    WARNING: ${UNRESOLVED} item(s) had unreadable content — the token is probably missing" >&2
  echo "             repository access for the repo those issues live in." >&2
fi
This exists because of the one-row case from the previous article. An item pointing at a repository the token could not see produced a row with no title, no labels and therefore no scope or phase, and the run succeeded. One row out of ~1,400 is invisible. The same gap across a new repository would not be, and by then nobody would connect it to a permissions change made weeks earlier.
The general principle: when a partial failure is possible and silent, spend the four lines to make it loud.
Step 4: The job
resource "azurerm_container_app_job" "roadmap" {
  name                         = "caj-<project>-devops-board-<region>"
  container_app_environment_id = azurerm_container_app_environment.roadmap.id

  replica_timeout_in_seconds = 3600
  replica_retry_limit        = 2

  schedule_trigger_config {
    cron_expression          = "0 5 * * *"
    parallelism              = 1
    replica_completion_count = 1
  }
  ...
}
Daily at five in the morning UTC, an hour before the cost job and half an hour before the CRM one, so the three are not competing for the same ingestion endpoint.
The timeout is an hour rather than the thirty minutes the other collectors get, because this job later grew a second responsibility that walks every repository in the organisation. That is the developer activity collector, two articles from now.
A note on the name. It is board, not roadmap. A Container Apps Job name is capped at thirty-two characters, caj-<project>-devops- plus -shared-eus2 spends twenty-six of them, and roadmap needs seven. The provider only enforces this at apply, after the plan has printed a clean summary, so both of my job names looked fine right up until the run meant to create them. The Terraform resource labels keep the longer words; only the Azure names are abbreviated.
Step 5: Expect the schema change to be slow
This is the one that cost me three failed runs and the better part of an evening, and it is worth more than the rest of the article if you are about to do this yourself.
A DCR schema change takes several minutes to reach the ingestion endpoint. I applied a schema change adding seven columns and a new stream, then triggered the job about thirty seconds later.
Two different failures came out of one cause:
The new stream was rejected outright, with a clear message saying the stream was not configured in the data collection rule. Loud, obvious, easy to diagnose.
The new columns on the existing stream were silently dropped. The job reported “ingested 1409 rows” and succeeded. The rows were there. Every new column was null.
That second one is nasty because everything says it worked. I checked the table, saw the new columns existed, saw rows arriving, and concluded the collector was not populating them. I went and read the deployed script to check the right version had shipped. It had. The DCR in Azure had the columns. The endpoint’s cached copy did not.
The tell, in hindsight, was that the loud failure and the silent one were reported in the same run. One cause, two symptoms, and the noisy one was telling me what was wrong with the quiet one.
Wait five to ten minutes after any DCR schema change before you judge the results. I now do that as a matter of course, and I would rather lose ten minutes than repeat that evening.
What a run looks like
--> Fetching project OrgName/6
    15 page(s), 1400 items
    reshaped 1400 rows
    in scope: 150, complete: 48
    ingested 1400 rows into Custom-GitHubWorkItem_CL
Conclusion
The collector itself is unremarkable, which is the point: it is the same shape as the two before it, and the parts worth writing down are the decisions rather than the code.
Snapshotting a board every day feels wasteful until you want to know what it looked like last month, at which point it is the only thing that works. The line I would draw for anybody building something similar is between configuration and definition: things that depend on your label conventions belong in the collector where they can be parameterised, and things the dashboard argues about belong in the saved function where they can be retuned without re-collecting. And whatever else you do, wait for the DCR to propagate before you conclude your collector is broken. The next article is the second job, which runs every fifteen minutes and exists because this one runs every twenty-four hours.