Reading a GitHub Project Board With GraphQL
The last two integrations in this series were about money and about sales. This one is about our own delivery, and it is the one where I made the most mistakes and got the most useful answers.
The starting question was simple enough: how close are we to MVP complete, and how is each delivery phase doing. It grew from there. How many pull requests are open across the backend services and how long have they been sitting. Are any GitHub Actions failing. How far ahead of main is each service, so we know how much change is about to go from dev to production. Who is holding work that has stopped moving.
That ended up being two collectors on different schedules and five dashboards. This article is about the source: why the API forces GraphQL on you, why you have to read the project board rather than the issues, and the scopes it genuinely needs.
There is no REST API for a project board
GitHub Projects, the current version, has no REST endpoints. The board, its items, its Status column and every custom field are reachable only through GraphQL. That is not a preference, it is the whole of the choice.
It also rules out the gh CLI as an implementation detail, at least for us. gh is not in the stock azure-cli image our collectors run in, so it would be a second thing to install and pin, and a raw GraphQL POST with curl is not meaningfully harder:
curl -s -X POST https://api.github.com/graphql \
  -H "Authorization: Bearer ${GITHUB_TOKEN}" \
  -H "Content-Type: application/json" \
  --data "$BODY"
One thing to know before you start debugging: GraphQL answers 200 with an errors array. A non-zero exit from curl is not the failure to check for. Check the payload:
if echo "$RESP" | jq -e '.errors' >/dev/null 2>&1; then
  echo "ERROR: GitHub GraphQL returned errors: $(echo "$RESP" | jq -c '.errors')" >&2
  exit 1
fi
Read the board, not the issues
This is the decision that shaped everything downstream and it is worth being explicit about.
The obvious approach is to list issues. Issues have labels, assignees, a created date and a closed date, and there is a perfectly good REST API for them. It is also the wrong data.
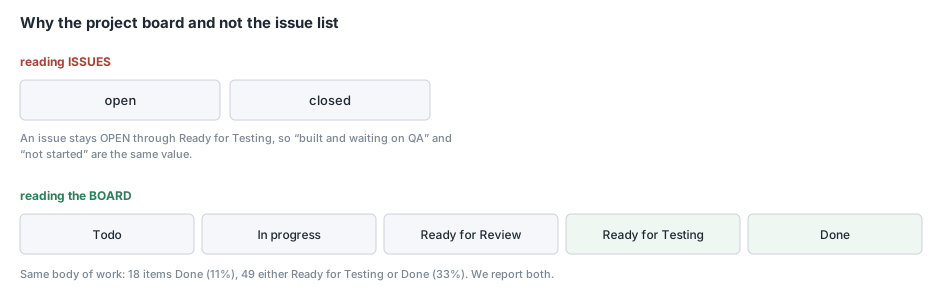
An issue has two states: open and closed. Our board has five columns: Todo, In progress, Ready for Review, Ready for Testing, Done. An issue sits open all the way through Ready for Testing, because the work is finished and waiting on QA. Reading issues reduces every question about progress to open versus closed, which is the measure the team stopped using precisely because it could not distinguish “not started” from “built and waiting to be verified”.
The gap is not academic. On our board, counting only Done against counting Ready for Testing or Done gives two numbers roughly twenty points apart for the same body of work. Which one you report depends entirely on whether you read the board or the issues, and neither is wrong so long as you know which one you have.
We report both, labelled “done done” and “dev complete”, which matches how the team already uses the words.
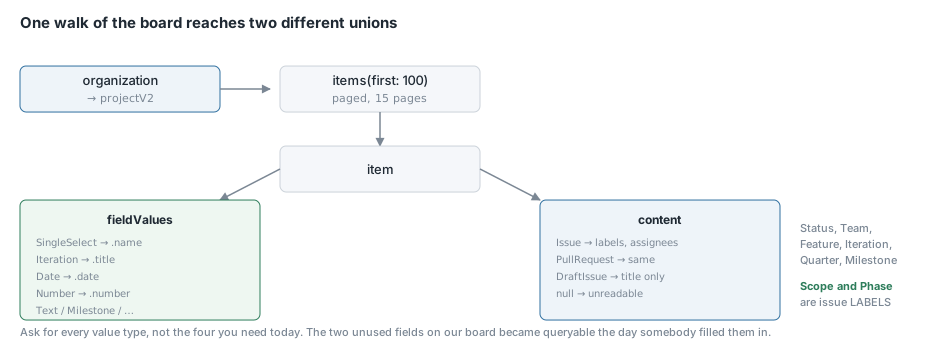
The complication is that the interesting attributes are split across the two objects. Status, Team, Feature, Iteration and Quarter are project fields. Scope and Phase are issue labels. So the query has to walk the board and reach through each item into its content:
query($org: String!, $number: Int!, $after: String) {
  organization(login: $org) {
    projectV2(number: $number) {
      items(first: 100, after: $after) {
        pageInfo { hasNextPage endCursor }
        nodes {
          id
          fieldValues(first: 40) { nodes { ... } }
          content {
            __typename
            ... on Issue {
              number title url state createdAt closedAt updatedAt
              repository { name }
              labels(first: 25) { nodes { name } }
              assignees(first: 10) { nodes { login } }
            }
            ... on PullRequest { ... }
            ... on DraftIssue { title createdAt updatedAt }
          }
        }
      }
    }
  }
}
Field values are a union, and that is more annoying than it sounds
A project field value is a GraphQL union, and each member carries its value under a different key. A single-select has name. An iteration has title. A date has date. A number has number. Text has text. A milestone has a nested object.
My first version asked for three of those types and mapped four fields by name:
... on ProjectV2ItemFieldSingleSelectValue { name  field { ... on ProjectV2FieldCommon { name } } }
... on ProjectV2ItemFieldIterationValue  { title field { ... on ProjectV2FieldCommon { name } } }
... on ProjectV2ItemFieldDateValue       { date  field { ... on ProjectV2FieldCommon { name } } }
That worked, and it was short-sighted in a way I would like you to avoid.
Two fields on our board, Quarter and Milestone, were defined but not being used. Nobody had tagged anything with them yet. Because I was mapping four named fields, those two were not collected, and the day somebody started using them there would have been no history behind the new column. Worse, any field added in future would be invisible until somebody remembered to edit the collector.
The fix is to ask for every value type and land them all in one dynamic column:
| ([ .fieldValues.nodes[]
     | select(.field.name != null)
     | {key: .field.name,
        value: ( .text // .name // .title // .date
                 // (if .number != null then (.number | tostring) else null end)
                 // (.milestone.title)
                 // (if (.labels.nodes // []) != [] then ([.labels.nodes[].name] | join(", ")) else null end)
                 // (if (.users.nodes // []) != [] then ([.users.nodes[].login] | join(", ")) else null end)
                 // (.repository.name) ) }
     | select(.value != null) ] | from_entries) as $f
Log Analytics supports a dynamic column type, so that object goes in whole:
{ name = "Fields", type = "dynamic" },
and KQL reaches into it with Fields.Quarter or Fields["Some New Field"]. A field somebody starts using next month is queryable immediately, with no schema change, no apply, and no gap in the history behind it.
The four fields every panel already leans on keep dedicated columns as well, because tostring(Fields.Status) in forty panels would be tedious and slower.
Store labels twice
Related, and a small thing that prevents a specific bug.
Labels are stored both as a comma-joined string and as a dynamic array:
{ name = "Labels",     type = "string" },
{ name = "LabelArray", type = "dynamic" },
The string reads well in a table. The array is what makes membership tests exact:
| extend IsBug = LabelArray has "bug"
Substring matching on the joined string would count debug and bugfix as bugs. The equivalent trap on our phase labels is worse: PHASE-1 is a prefix of PHASE-10, and the day somebody creates that label, a substring match starts counting phase 10 work as phase 1 with no error and no obvious symptom.
For the same reason, the collector resolves phase by exact match against an ordered list, first match wins:
Phase: ([ $phaseList[] | select(. as $p | $labels | index($p)) ] | first // "")
One item on our board carries two phase labels, so “first match wins” is a real rule rather than a theoretical one, and it makes the phase buckets exclusive even though the labels are not.
Iteration windows make a burn-down possible
The iteration field value carries more than a name. It has startDate and duration, and those are what turn a sprint label into a sprint.
... on ProjectV2ItemFieldIterationValue { title startDate duration field { ... } }
Without the window there is no denominator and no “days remaining”, so there is no burn-down. With it, each item knows its own sprint bounds, and “is this the current sprint” becomes a comparison rather than a hardcoded name:
| extend IsCurrentSprint = isnotnull(IterationStart)
                           and IterationStart <= now() and now() < IterationEnd
That definition rolls over on its own when the next iteration starts. Nobody has to edit a dashboard on sprint boundary day, which is exactly the sort of maintenance that does not get done.
The end is computed as start plus duration and treated as exclusive, so a fourteen-day sprint starting on the fifth runs through the eighteenth.
The scopes, properly this time
I got scopes wrong three times on the HubSpot integration by reasoning about endpoints instead of testing. For GitHub I tested each one, and the results were not what I would have guessed.
Use a fine-grained personal access token, and set the resource owner to the organisation, not to your personal account. Get that wrong and the token authenticates fine, then returns null for the org project, which looks exactly like a missing scope.
The permissions:
| Permission | Why |
|---|---|
| Organization → Projects: Read-only | The board, its items, and all field values |
| Repository → Issues: Read-only | Issue titles, labels and assignees |
| Repository → Contents: Read-only | Branch comparison, commits, branches |
| Repository → Pull requests: Read-only | Open PR listing |
| Repository → Actions: Read-only | Workflow runs |
| Repository → Metadata: Read-only | Mandatory, auto-selected |
Two of those are easy to under-scope.
Issues is the one people skip, because “it is a project dashboard, why do I need issues”. Scope and Phase are issue labels. Without this permission the collector returns every item successfully, and every one of them has an empty Scope and Phase, so the MVP percentage, the phase table and the burn-up are all blank while the job reports success.
Contents is the one I got wrong. Branch comparison feels like metadata, and it is not. /compare, /commits and /branches are all Contents-scoped reads. I confirmed by testing each endpoint against a token that had everything else, and getting three 403s and three 200s in a very clean split.
On repository access: grant all repositories rather than a selected list, unless you have a strong reason not to. I started with two repos, because that is where the board’s items lived. One item on the board pointed at an issue in a third repo, and its content came back null, which the collector recorded as ContentType: "Unknown" with no title and no labels. One row out of ~1,400, already closed, entirely harmless, and completely silent. It would have grown as the board spread across more repos. The collector now warns when any item’s content fails to resolve, because a missing repository grant should be findable in the logs rather than showing up as an unexplained dip.
Do not use a classic token. It would work with read:project plus repo, but GitHub documents repo as “full access to public and private repositories including read and write access to code”. That is write access to every repository in the organisation, held by a nightly job, in order to read a backlog. The fine-grained set above is strictly narrower and does the same work.
One operational note: a fine-grained PAT expires. When it does, the job fails silently on its schedule and the dashboards simply stop moving. Either set a long expiry with a calendar reminder, or make a habit of checking the collector logs if a chart flatlines.
Conclusion
The API forces two decisions on you and both turn out to be the right ones anyway. GraphQL is the only way in, and reading the board rather than the issues is the only way to distinguish “not started” from “built and waiting on QA”.
The decision that was genuinely mine, and the one I would repeat, is collecting every project field into a dynamic column rather than mapping the four I needed that afternoon. It cost a few extra lines in a jq expression and it means the two fields nobody was using yet, and any field added later, arrive with their history intact rather than starting from the day somebody remembers to update the collector. Schema decisions in an append-only store are hard to walk back, and “collect it all and decide later” is much cheaper than it sounds. The next article is the collector that runs this query.