Application Insights is Working — So Why Does the Azure Portal Make Me Feel Otherwise?
Setting up observability for Azure Functions should be a straightforward process. After all, Microsoft provides Application Insights (App Insights) as a built-in solution to capture logs, metrics, and performance telemetry. However, while the actual ingestion of data works as expected, the user experience within the Azure Portal creates more confusion than confidence.
Even when App Insights is properly configured and fully functional, the interface often makes users second-guess whether it’s working at all. The problem is not that App Insights is broken; it’s that the portal’s design does not manage perception well. Instead of reinforcing that everything is set up correctly, the portal overwhelms users with redundant messages, unnecessary warnings, and UI elements that hint at incomplete setup when everything is actually fine.
A Functional Yet Confusing Setup
After setting the APPLICATIONINSIGHTS_CONNECTION_STRING in the environment variables, everything appears to be working as expected.
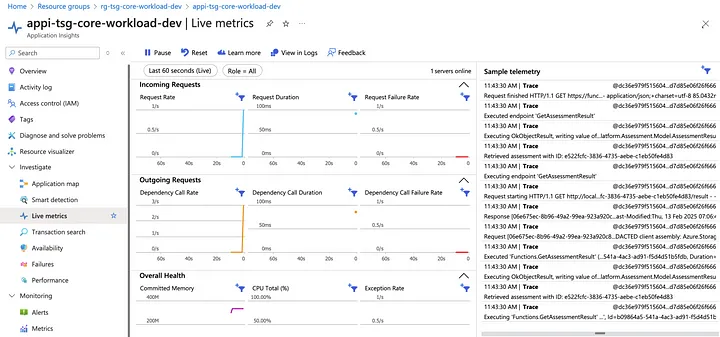 App Insights Live Metrics
Live Telemetry and Transaction Search both show up in App Insights, proving that logs and custom events are flowing in as intended.
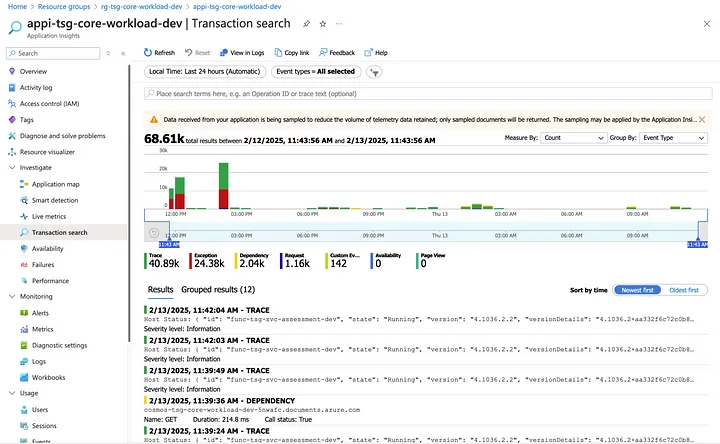 App Insights Transaction Search
However, navigating to the Azure Functions monitoring section in the portal introduces a wave of ambiguity.
Under the Monitoring section of the Azure Function, several tabs are available:
- ✅ Alerts
- ✅ Metrics
- ✅ Advisor Recommendations
- ✅ Health Check
- ❓Application Insights
- ❓Logs
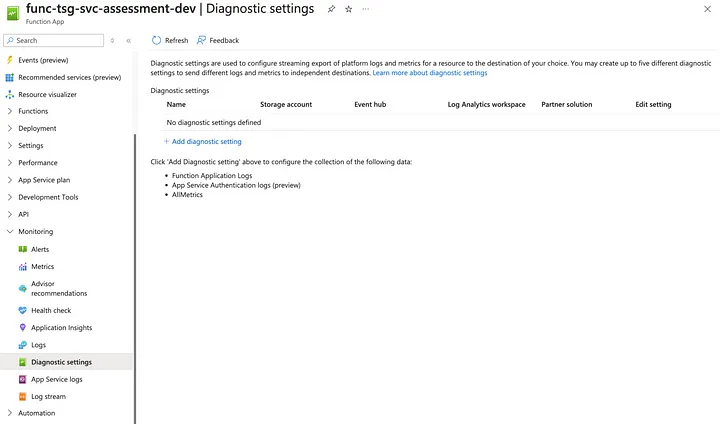
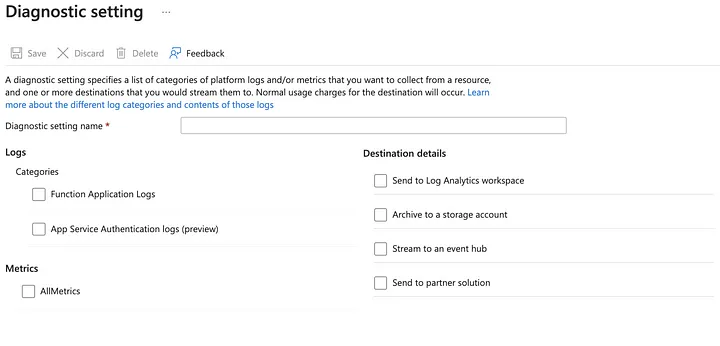
- ✅ Diagnostic Settings
- ❓App Service Logs
- ❓Log Stream
Alerts, Metrics, and Diagnostic Settings all work as expected. Advisor Recommendations and Health Checks are really unrelated functionality towards my purpose of getting logs setup. So let’s focus on the four that are questionable — and why.
Too Much Information
I bundle these two together because the experience is the same for both tabs. The experience is as stressful as it is perplexing. Navigating to the Application Insights tab should ideally confirm that logging is working. Instead, the user is immediately greeted with a set of perplexing blue information boxes that introduce more doubt than clarity.
It doesn’t give me the warm and fuzzies when I come to the page and I am blasted with blue information boxes.
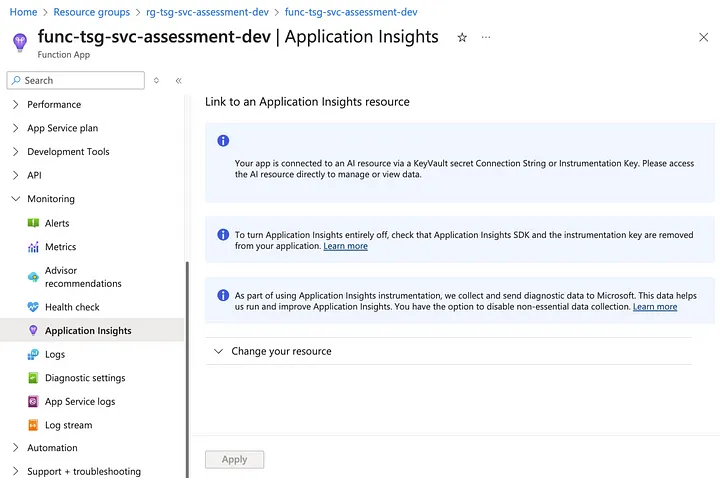
Message №1: You’re using KeyVault — go somewhere else!
Your app is connected to an AI resource via a KeyVault secret Connection String or Instrumentation Key. Please access the AI resource directly to manage or view data.
This message implies that because the instrumentation key is stored in KeyVault, I cannot use this screen to verify or manage App Insights. However, the reality is that App Insights is functioning perfectly fine; it’s just that the portal refuses to acknowledge it here. Instead of providing reassurance, this message makes me feel like I’m looking in the wrong place, even when I’m exactly where I should be.
Message №2: Do you know how to turn off App Insights?
To turn Application Insights entirely off, check that Application Insights SDK and the instrumentation key are removed from your application. Learn more
Why is this page giving me instructions on how to disable App Insights? If I’ve navigated here, I’m more likely trying to confirm that my telemetry is working — not looking for ways to turn it off. This feels misplaced, as if it’s preemptively encouraging me to remove the very feature I came to verify.
Message №3: We collect your data.
As part of using Application Insights instrumentation, we collect and send diagnostic data to Microsoft. This data helps us run and improve Application Insights. You have the option to disable non-essential data collection. Learn more
A general compliance message like this is fine, but when combined with the previous two messages, it just adds to the noise. At this point, I’m three notifications deep, and not one of them has told me whether my setup is correct or if there’s an issue I should actually be worried about.
The “Change Your Resource” Trap
When I expand “Change your resource” it gets even more confusing!
This UI gives the impression that I need to set up App Insights — despite it already being configured and working. The options presented make it seem like I either need to create a new App Insights instance or manually select my existing one (which is already connected).
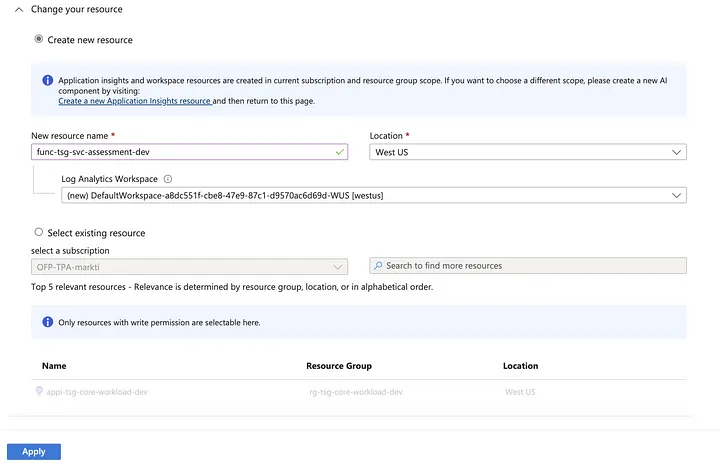
It puts me into a screen where it looks like I am setting up App Insights. Wait — isn’t it already setup?! Do I need to do this again?
I honestly wonder how many of our customers accidentally created yet another App Insights instance because this user experience made them think they hadn’t actually setup App Insights. Doh!
The second option — tragically and ironically — is that I can select and existing resource — like the one I am currently connected to!
App Service Logs: Who’s on First?
At this point, I turn to Diagnostic Settings, thinking it might provide clarity. After all, I already configured App Insights, so this should be straightforward. But instead of clear confirmation, I find yet another ambiguous step. The expectation is that logs and metrics should flow into Log Analytics, but it’s not entirely clear if that’s happening.
It shouldn’t be that hard either because I’ve already setup App Insights which requires a Log Analytics workspace so I can just write my metrics and logs there.
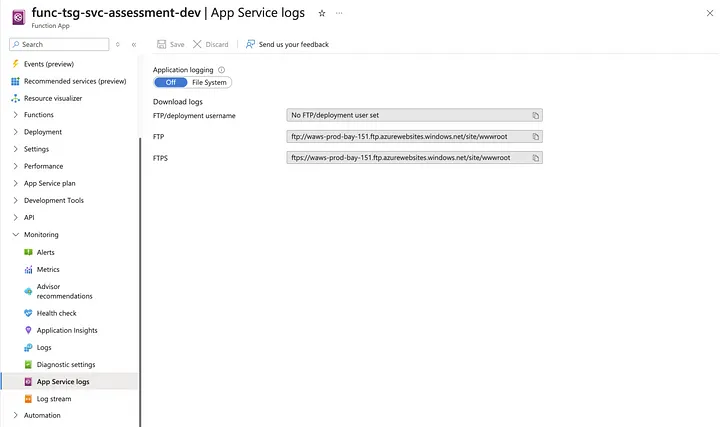
The App Service Logs page is another odd experience. It suggests that logs are being written to the filesystem, which seems unnecessary unless they are also being routed into my Log Analytics Workspace. However, the relationship between Diagnostic Settings and App Service Logs is unclear. Are they working together, or are they separate?
Maybe the “Function Application Logs” category from the Diagnostic Setting will do this — or maybe they work together?
Log Stream: A Fulfilled or Unfulfilled Promise?
The Log Stream feature is particularly disappointing because it sounds so promising — real-time logs from my Azure Function, similar to what Live Metrics provides in App Insights. However, instead of showing me a live feed of logs, it simply states: “Configure Application Insights to capture invocation logs.”
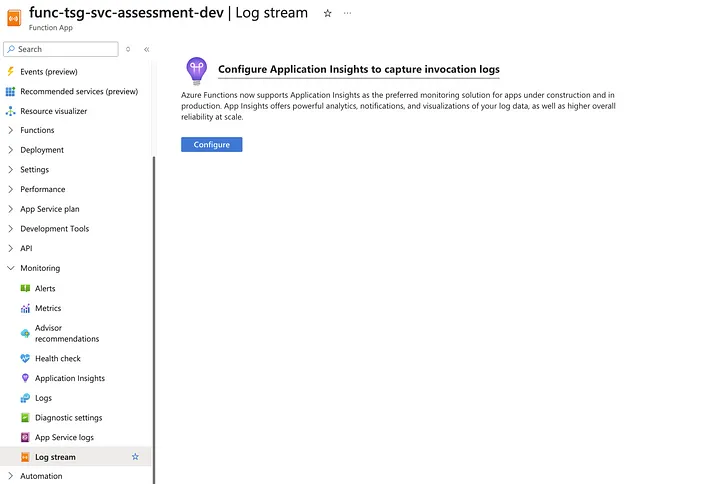
It simply says “Configure Application Insights to capture invocation logs”. Interesting, isn’t that already being done with my App Insights instance? I can see every invocation of my Azure Function in the App Insights Transaction History. What is different about this? What can I see here that isn’t already in App Insights?
Oddly, I will never know because the Configure button simply page navigates me to the “App Insights” tab with the blue information boxes and the oddly redundant “Change your service”.
I guess that settles it — it’s already setup. Right?
Conclusion
The problem with the Azure Portal’s Application Insights experience isn’t that it fails to collect telemetry — it does that just fine. The problem is that it fails to communicate that telemetry is being collected in a way that reassures users.
Instead of providing confidence, it introduces ambiguity. Messages that should confirm successful setup instead lead users to question whether they need to take additional steps. Options that should reinforce proper configuration instead create the illusion of incomplete setup.
When everything is working properly, the UI should reflect that. It should reassure users instead of making them second-guess their setup. App Insights is a powerful observability tool, but until the portal experience aligns with its functionality, it will continue to create unnecessary doubt rather than confidence.