Stale, Stuck, or Never Started: Defining a Dashboard's Vocabulary
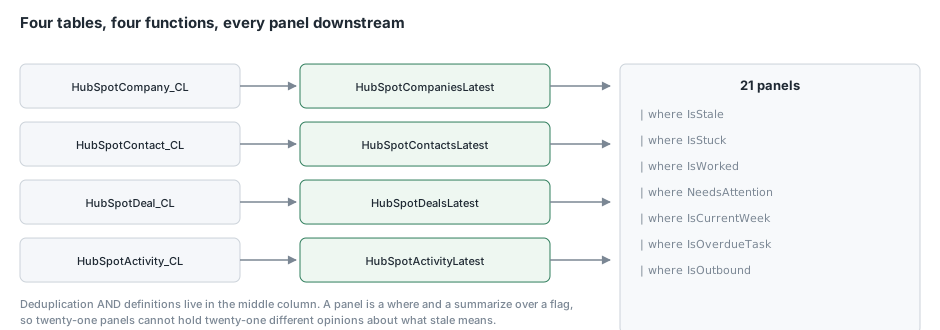
The collector from the previous article lands four tables in Log Analytics: daily snapshots of companies, contacts and deals, and a rolling window of engagements. This article is the layer between those tables and the dashboard, which is four saved KQL functions.
I covered the mechanics of saved functions earlier in this series, and the deduplication here is the same pattern. What is different, and what this article is really about, is that these functions carry definitions rather than just dedup keys. Deciding what “stale” means turned out to be the hardest thinking in the whole project, and my first answer produced a dashboard nobody could use.
The deduplication, briefly
Same shape as the cost function, with one difference worth noting.
For the state tables, you scope to the newest snapshot rather than taking arg_max across all history:
HubSpotDeal_CL
| where SnapshotDate == toscalar(HubSpotDeal_CL | summarize max(SnapshotDate))
| summarize arg_max(TimeGenerated, *) by DealId
That distinction matters. arg_max over all history keeps the last thing you ever saw about a deal, so a deal deleted in the CRM stays on your board forever. Pinning to the latest snapshot means a deleted deal simply stops appearing tomorrow, which is what you want and costs nothing.
The engagement function is the opposite, because those are events. No snapshot scoping, just a dedup by identity:
HubSpotActivity_CL
| summarize arg_max(TimeGenerated, *) by ActivityType, EngagementId
Recall from the mechanics article that none of these can open with a let. A saved search used as a function must be a single tabular expression, so the “newest snapshot” scalar is inlined into the where rather than bound above it.
Three failures that are not the same failure
The first real definition question was what makes a deal worth flagging. My first version had one flag called IsStale, meaning nobody had logged anything against it recently.
That is a real failure and it is not the only one. Watching the data for a week, three distinct things were going wrong and they need different responses:
Stale. Nobody has logged anything. The deal is quiet.
Stuck. It has not changed pipeline stage. This is the one that matters most and it is the one a single flag hides, because a deal can be worked every week and still be stuck. Notes, calls and emails all logged, activity looks healthy, and it has not advanced in five weeks. On an activity report that deal looks like your best-tended opportunity.
Overdue. Its close date, which the rep set themselves, has already passed.
Collapsing those into one “at risk” number means the deal that is being diligently worked and going nowhere is indistinguishable from the deal nobody has touched. So they are three flags:
| extend LastTouch = coalesce(LastActivityDate, CreateDate)
| extend DaysSinceActivity = datetime_diff('day', now(), LastTouch)
| extend DaysInStage = datetime_diff('day', now(), coalesce(StageEnteredDate, CreateDate))
| extend IsOpen = IsClosed == false
| extend IsStale   = IsOpen and DaysSinceActivity >= 14
| extend IsStuck   = IsOpen and DaysInStage >= 21
| extend IsOverdue = IsOpen and isnotnull(CloseDate) and CloseDate < now()
| extend NeedsAttention = IsStale or IsStuck or IsOverdue or (IsOpen and HasOwner == false)
Two details in there.
The thresholds differ. Stale is fourteen days, stuck is twenty-one. Moving a deal to the next stage is a bigger event than logging a note, so holding both to the same clock would flag every healthy deal as stuck.
coalesce(LastActivityDate, CreateDate) matters more than it looks. A deal that has never had an activity logged has a null there. If you leave it null, datetime_diff returns null, the comparison is false, and the deal is not flagged. The worst case sorts itself out of the list designed to catch it. Falling back to the creation date says “nothing has happened since this existed”, which is the truth.
The mistake: seven in ten is not a list
Here is the one I got properly wrong.
Having decided companies mattered more than deals, I applied the same logic to them. An account is stale if nobody has touched it in thirty days, or if it has no owner. Reasonable.
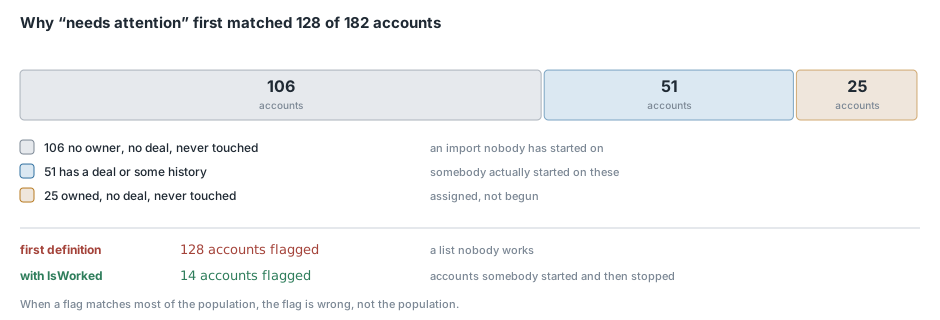
The dashboard came back flagging roughly seven in ten accounts, and about three quarters of the leads.
That is not a signal. That is a list nobody will ever work, on a wall display people will learn to ignore within a week.
The numbers were correct. The definition was wrong. Breaking the population down showed why:
owner=False  deal=False  everTouched=False   ~58%
owner=True   deal=False  everTouched=False   ~14%
owner=True   deal=False  everTouched=True    ~13%
owner=True   deal=True   everTouched=True    ~11%
owner=False  deal=False  everTouched=True     ~4%
Well over half the companies had no owner, no deal and no activity ever. Those are an import. Somebody loaded a list and nobody has started on them. That is a data hygiene job with a completely different fix from “this account was being worked and went quiet”, and putting the two in one list buries the dozen that matter under a hundred that do not.
The fix is a flag that separates the populations:
| extend IsWorked = HasDeal or HasActivity
| extend NeedsAttention = IsWorked and (IsStale or HasOwner == false)
Seven in ten becomes fewer than one in ten. What is left are accounts somebody actually started on and then stopped.
The leads had the same problem and a more interesting split. Applying the equivalent filter more than halved the list, and within what remained there were two genuinely different failures, in a roughly five-to-one ratio:
have an OWNER and have never been contacted     the large majority
were contacted, then went quiet                 the rest
Those want different conversations. One is “you were assigned this and never started”, the other is “you started this and dropped it”. So the panel names them rather than lumping them:
| extend Why = case(EverContacted == false and HasOwner, "assigned, never contacted",
                    EverContacted == false, "never contacted, no owner",
                    HasOwner == false, "contacted, then left unowned",
                    "worked, then went quiet")
The general lesson, which I think applies well beyond CRM data: when a flag matches most of the population, the flag is wrong, not the population. And the way to find out is to cross-tabulate the population before you trust the count.
Configuration for things the source system has no opinion about
Some of these definitions are judgement calls that will change. Those live in Terraform variables rather than in the KQL, and get interpolated into the function body:
variable "stale_deal_days"    { type = number  default = 14 }
variable "stuck_deal_days"    { type = number  default = 21 }
variable "stale_account_days" { type = number  default = 30 }
variable "stale_lead_days"    { type = number  default = 14 }

variable "active_lead_stages" {
  type    = list(string)
  default = ["lead", "marketingqualifiedlead", "salesqualifiedlead", "opportunity"]
}
Interpolating a list into a KQL in clause needs a little formatting:
| extend IsActiveLead = tolower(LifecycleStage) in (${join(", ", formatlist("\"%s\"", var.active_lead_stages))})
The account threshold is thirty days against fourteen for deals, because accounts without an open deal legitimately move slower and a two-week clock would drown the signal.
Activity targets, by contrast, do not live here at all. They are in the dashboard layer, because nothing about a target reaches the collector and presentation belongs beside the thing it colours. Getting that boundary right means you can retune what “on target” means without touching an ingestion pipeline.
Settling timezone questions once
The engagement function is where the week definition from two articles ago gets fixed in place, so no panel has to reimplement it:
| extend LocalCreated = datetime_utc_to_local(CreatedDate, "America/New_York")
| extend WeekStart = startofweek(LocalCreated - 1d) + 1d
| extend IsCurrentWeek = WeekStart == startofweek(datetime_utc_to_local(now(), "America/New_York") - 1d) + 1d
| extend IsToday = startofday(LocalCreated) == startofday(datetime_utc_to_local(now(), "America/New_York"))
IsCurrentWeek and IsToday are computed here rather than in the panels for the same reason as the week bucket: “this week” is a timezone question, and a panel that answered it in UTC would disagree with the table next to it for a few hours every Sunday night. Two panels disagreeing by a small amount for a few hours is the kind of bug that gets reported as “the dashboard is flaky”.
Also here, because it needs two fields and getting either half wrong turns a finished task into an alarm:
| extend IsOpenTask = ActivityType == "Task" and TaskStatus != "COMPLETED" and isnotempty(TaskStatus)
| extend IsOverdueTask = IsOpenTask and isnotnull(ActivityDate) and ActivityDate < now()
| extend IsOutbound = Direction !in ("INCOMING_EMAIL", "INCOMING")
IsOutbound is the one that makes follow-up time meaningful. Without it, a customer replying to us counts as us following up, and the metric measures the opposite of what it claims to.
What the functions expose
By the time a panel calls one of these, it gets a row with the raw fields plus a set of flags that encode every decision above. A panel that wants stale deals writes | where IsStale. A panel that wants this week’s activity writes | where IsCurrentWeek.
That is the property worth optimising for. When somebody asks why the headline says fourteen and the table below has nineteen rows, the answer should be a bug, not a philosophical difference between two panels.
Conclusion
The deduplication in these functions is mechanical and took an afternoon. The definitions took a week and two rewrites, and they are what makes the difference between a dashboard people act on and a dashboard people learn to scroll past.
The specific thing I would carry into any similar project is the population cross-tab. When I first flagged seven in ten accounts, my instinct was that the business had a big problem. The data said something more useful: two different problems had been added together, one of which was an import backlog and one of which was a follow-up failure, and only one of them belonged on this dashboard. Counting is easy. Deciding what belongs in the count is the work. The next two articles are the dashboard those functions feed.