Why Azure Cost Data Is Harder Than It Looks
The first thing we wanted on a dashboard that Azure Monitor could not give us was our own spend. We run across eight subscriptions, including a sandbox each for the developers, and the question “what did we spend yesterday, on what” was taking somebody five minutes of clicking through the portal to answer badly.
This should be the easy one. Azure knows exactly what we spent. It is Azure’s own data, in Azure’s own tenant, and there is a Cost Management API sitting right there. It took me longer than I expected, and the reason is a property of cost data that I had not thought about before and that will bite anybody who builds this naively.
This article is about the problem. The next one is the collector, then the query layer, then the dashboard.
What Cost Management gives you
There are two ways to get cost data out of Azure programmatically, and the difference matters.
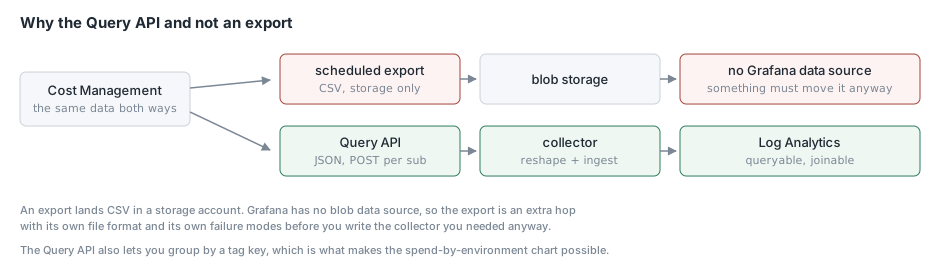
Exports are the officially recommended path. You configure an export, Azure writes CSV files to a storage account on a schedule, and you go and read them. That is a fine design if your destination is a data lake. It was no use to us, because Cost Management exports only target storage. There is no Log Analytics destination, and Grafana has no blob storage data source. Something would have to move the data anyway, and if something is going to move the data then the export is just an extra hop with its own file format and its own failure modes.
The Query API lets you POST a query and get JSON back. That is what we use:
{
  "type": "ActualCost",
  "timeframe": "Custom",
  "timePeriod": { "from": "...", "to": "..." },
  "dataset": {
    "granularity": "Daily",
    "aggregation": { "totalCost": { "name": "Cost", "function": "Sum" } },
    "grouping": [
      { "type": "Dimension", "name": "ResourceGroupName" },
      { "type": "Dimension", "name": "ServiceName" },
      { "type": "Dimension", "name": "MeterCategory" },
      { "type": "TagKey",    "name": "environment" }
    ]
  }
}
Daily granularity, grouped the way we want to slice it on the dashboard, including by a tag so we can split spend by environment. One POST per subscription.
The problem: cost data changes after the fact
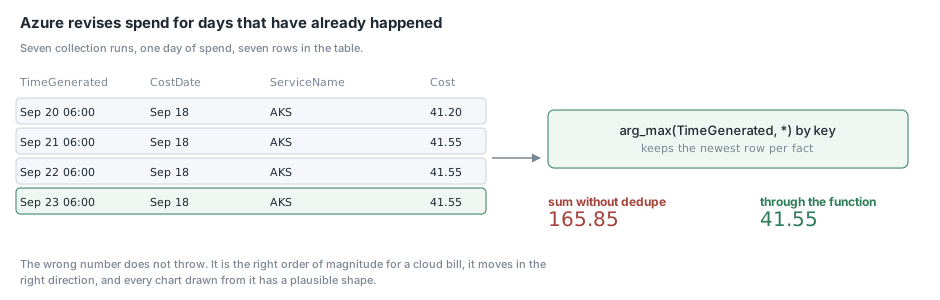
Here is the thing I did not know. Azure revises cost figures for days that have already happened.
A day’s spend is not final when the day ends. Usage records arrive late, reservations get amortised, credits get applied, and the number Azure reports for last Tuesday can be different tomorrow than it is today. Cost Management is not lying to you either time. It is reporting the best information it has when you ask.
If you build a collector that pulls yesterday’s cost once, writes it down and never looks again, your dashboard will slowly drift away from the invoice, and you will not notice because the drift is small and always in the same direction.
So the collector re-reads a rolling window on every run. Ours is seven days:
FROM=$(date -u -d "-${LOOKBACK_DAYS} days" '+%Y-%m-%dT00:00:00Z')
TO=$(date -u '+%Y-%m-%dT23:59:59Z')
Every run asks for the last seven days, and later, more accurate figures supersede the earlier provisional ones.
Which lands you directly on the constraint from the first article in this series: Log Analytics is append only. You cannot update the row you wrote yesterday. So “supersede” cannot mean overwrite. It has to mean write it again and sort it out at read time, which is what the whole of the third article is about.
The consequence is that the same day’s cost, for the same service, appears in the table seven times, deliberately. Any query that forgets to account for that reports seven times your actual spend. That is a spectacular way to be wrong, and it will look plausible if you have never seen the real number.
Two timestamps that mean different things
This falls out of the same problem and it is worth being explicit, because conflating them is the classic way to get a cost dashboard subtly wrong.
TimeGenerated is when we ingested the row. CostDate is the day the money was actually spent. They are usually a day apart and occasionally much further apart, because a restated row for last Tuesday arrives today.
Every chart on the dashboard is keyed on CostDate, because you want spend on the day it happened. TimeGenerated is used for exactly one thing, which is deciding which of the several copies of a given fact is the most recent. If you chart on TimeGenerated you get a picture of when your collector ran, which is not a question anybody has.
Our custom table declares both:
{ name = "TimeGenerated", type = "datetime" },
{ name = "CostDate",      type = "datetime" },
The tag is not a column
Grouping by a tag key is where the response shape gets awkward, and it produced the only genuinely wrong numbers we shipped.
When you ask Cost Management to group by TagKey: environment, the response does not come back with a tidy environment column. Depending on the shape of the data you can get a TagKey column whose value is the literal string environment and a TagValue column holding the actual value, or you can get the value quoted as "environment":"dev", and for resources with no tag at all you get a null.
My first attempt scanned the row for whatever column was not one of the known ones and used that as the environment. For untagged resources that picked up the TagKey column, whose value is always the literal string environment. The result was a chart with a series called “environment” sitting alongside dev and prod, made up entirely of untagged spend, and it looked enough like a real category that it took a while to question it.
The fix is to name the columns you know, skip TagKey explicitly, ignore nulls, and bucket what is left:
Environment: (($r.environment // $r.Environment // $r.TagValue // $r.Tag
               // ($r | with_entries(select(.key | ascii_downcase
                    | IN("usagedate","cost","currency","resourcegroupname",
                         "servicename","metercategory","tagkey") | not))
                  | to_entries | map(.value) | map(select(. != null))
                  | map(tostring) | map(select(. != "")) | first) // "")
              | tostring
              | sub("^\\s*\"?environment\"?\\s*:\\s*";"")
              | gsub("\"";"")
              | if . == "" or . == "environment" then "(untagged)" else . end)
That is not pretty and I am not going to pretend it is. The important part is the last line. Untagged spend buckets as (untagged) rather than being dropped, because a cost chart that silently omits spend is worse than one that shows you a category you do not like the look of.
Map columns by name, not position
One more shape problem worth mentioning because it is easy to get away with for a while.
The Query API returns rows as positional arrays plus a separate column list:
{
  "properties": {
    "columns": [ {"name": "Cost"}, {"name": "UsageDate"}, ... ],
    "rows": [ [12.34, 20260728, ...], ... ]
  }
}
It is tempting to index into the row by position. Do not. The order is not contractual and it has changed. Zip the column names onto each row and address the result by name:
(.properties.columns | map(.name)) as $cols
| [ .properties.rows[]
    | ([$cols, .] | transpose | map({key: .[0], value: .[1]}) | from_entries) as $r
    | { ... } ]
While I am here: UsageDate comes back as the integer 20260728, not a date string. It needs reassembling before Log Analytics will take it as a datetime.
The scopes you actually need
The collector authenticates with a user-assigned managed identity, and it needs exactly two role assignments.
Cost Management Reader, on each subscription you want to read. It is subscription scoped and read only. It grants query access to cost data and nothing else: no resource visibility, no data plane access. It is the minimum for what this job does.
resource "azurerm_role_assignment" "cost_reader" {
  for_each             = var.cost_subscription_ids
  scope                = "/subscriptions/${each.value}"
  role_definition_name = "Cost Management Reader"
  principal_id         = azurerm_user_assigned_identity.job.principal_id
  principal_type       = "ServicePrincipal"
}
Monitoring Metrics Publisher, scoped to the one data collection rule the job writes through. As I mentioned in the first article, the name says metrics and it is what the Logs Ingestion API checks.
That is the whole permission surface. The identity can read spend figures on eight subscriptions and write rows into one table. It cannot see a resource, read the workspace back, or touch anything else.
One practical note: the ingestion endpoint is a different audience from ARM, so the job needs two tokens, not one.
az login --identity --client-id "$AZURE_CLIENT_ID"
INGEST_TOKEN=$(az account get-access-token \
  --resource "https://monitor.azure.com" --query accessToken -o tsv)
Fail loudly on a partial read
Cost Management is aggressively rate limited. With eight subscriptions in a loop, a 429 is expected rather than exceptional, so the collector backs off and retries:
for ATTEMPT in 1 2 3 4 5; do
  if RESPONSE=$(az rest --method post --url "..." --body "$QUERY" 2>/tmp/cm.err); then
    break
  fi
  if grep -q "429\|Too many requests" /tmp/cm.err; then
    sleep $((ATTEMPT * 20))
  else
    break
  fi
done
Retries are close to free here, because the rolling lookback window makes every run idempotent in effect. Re-reading a subscription costs an API call and produces rows that supersede the ones you already had.
The part I care more about is what happens when the retries are exhausted. The collector counts the subscriptions it could not read and exits non-zero at the end if any failed:
if [[ "$FAILED" -gt 0 ]]; then
  echo "ERROR: ${FAILED} subscription(s) could not be read — totals are incomplete" >&2
  exit 1
fi
This matters more than it looks. A partial read produces a dashboard showing a total that is missing a subscription, and it looks exactly like a dashboard showing a total that includes every subscription. That is the specific failure mode that made our numbers wrong in the first place, back when we were collecting only two subscriptions and had not noticed the other six existed. A job that fails loudly is much better than a number that is quietly short.
Conclusion
Cost data looks like the easiest thing in the world to put on a dashboard right up until you learn that Azure revises it after the fact. Once you know that, three decisions follow immediately and none of them are optional: re-read a rolling window rather than pulling each day once, keep the ingestion time and the spend date as separate columns because they answer different questions, and accept that the same fact will be in your table many times over so the deduplication has to happen somewhere deliberate.
The other lesson is about failure modes. Almost everything that went wrong here was silent. An untagged bucket that presented itself as a real category, a positional column mapping that would break on an API change without warning, a partial subscription read that produces a total which is simply too small. None of those throw an error. On a dashboard nobody is auditing, a plausible wrong number can sit there for months. The next article is the collector itself, where most of the code is dealing with exactly these cases.